
How many times have you plugged some numbers into one of those calculators only to receive some magical savings goal, and then said to yourself, okay … now what?
It just leaves you hanging with so many un-answered questions!
What happens if I really do hit that BIG number? Will life be all peaches? Will my money last me forever and ever? What if the market does really poorly? What’s the probability? Over time, how will my savings look then?
What if that “magic number” the calculator spits out is too conservative, and I could do just fine by saving less money? What about Social Security? How will that affect my future savings goals?
These are all common complaints that I know I’ve had in the past with retirement payout calculators, and I’m sure I’m not alone. That’s why for years I’ve used a very detailed Excel spreadsheet to try to “customize” and help gauge what my finances will look like throughout the major phases of my retired adult life.
… That is until now! I’m happy to report that I’ve been playing with a fun, new toy lately that might just address all the problems I’ve listed above. It’s a retirement payout calculator made by Personal Capital and it’s just one of the many tools you get when you sign up for a free account.
Hands down, this has got to be one of the most comprehensive and best retirement calculator tools around. Here’s how it works and why I like playing with this new toy.
Personal Capital’s Retirement Payout Calculator
First things first, the main thing I like about this retirement planner is that rather than just telling you one big savings number you supposedly have to hit, it instead gives you a graph that gives you a complete snapshot of what your retirement years will look like for the rest of your life.
Check it out!
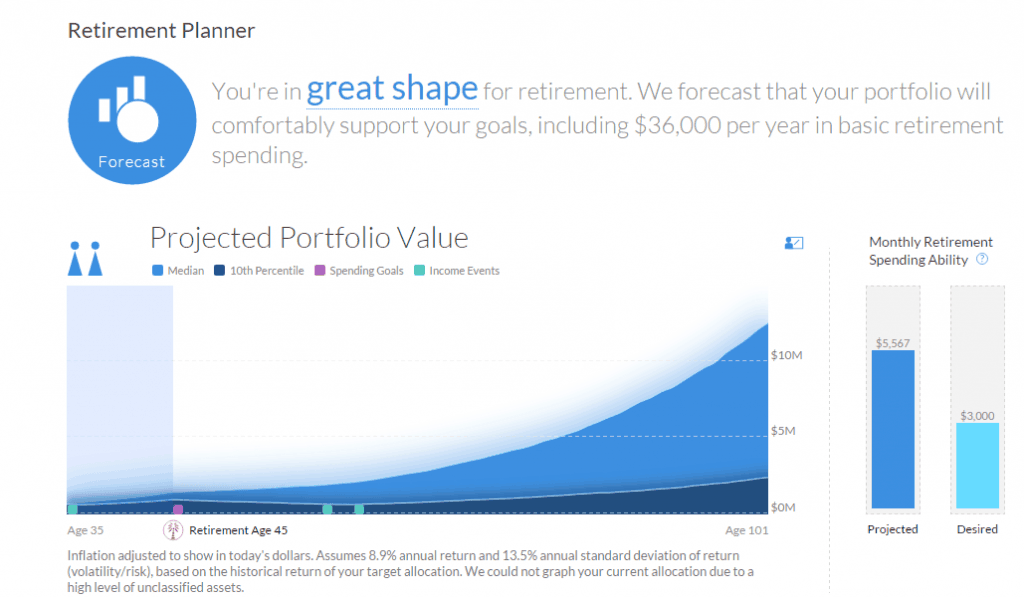
Let’s talk a little bit more about what you’re seeing here. This graph was created using 5,000 random simulations.
- Light blue upper section of the graph – This is what your money will look like with a 50% “normal” probability of success. In other words, you’ve got a half-and-half chance that this is how the market will perform and how long your money will last.
- Dark blue lower section of the graph – This is what your money will look like with a 10% “worst case” probability of success (if the market behaves poorly). No one likes to dwell on the negatives, but when it comes to retirement planning, it’s always important to consider worst-case scenarios.
Combined, this software puts the two cases together in one graph to give you a complete visual representation of what those outcomes will look like.
That’s pretty cool!
How Do We Get These Numbers?
That’s just it – it’s all based on your inputs.
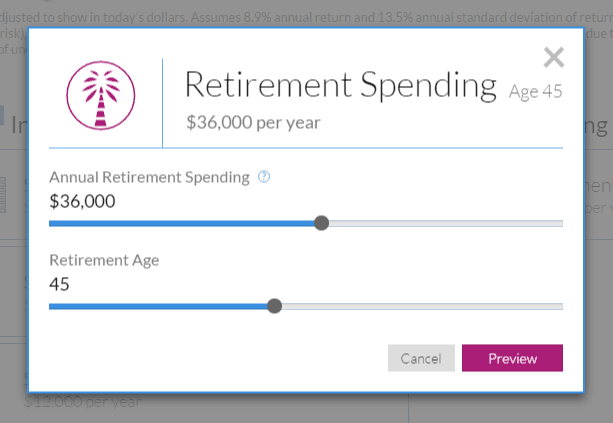
On the left, you can start by entering in your annual retirement spending.
On the right side you have a multitude of things you can adjust. These include such things as:
- How much money you’ve saved already. (If you want to be really slick, you can use the net worth balance that Personal Capital keeps track of for you.)
- How much you plan to save each year.
- Whether you’re married or not.
- What you think your tax rate will be.
- When you (and your spouse) plan to take Social Security. How much will it be?
- What you believe the rate of inflation to be (if you think it’s more or less than 3%).
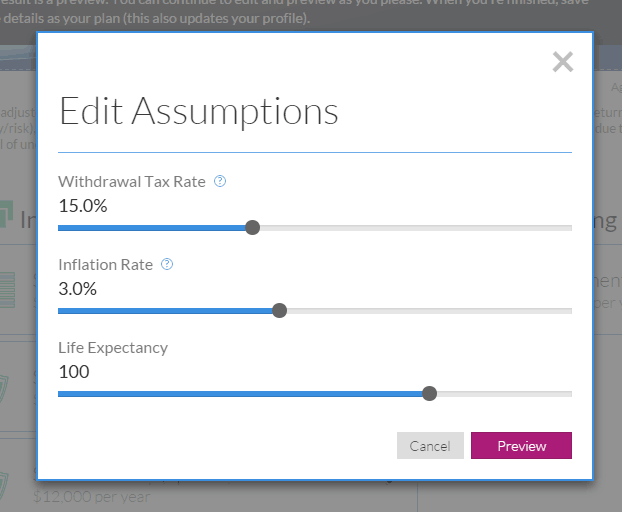
Don’t feel overwhelmed! If you don’t know the answers, there are default settings for all of these variables. So even if you don’t know the answer, you’ve already got a reasonable number to use.
Want to change those numbers? No problem! You just move the slider up/down, left/right, whatever, and your graph will automatically adjust.
How Will I Know If My Retirement Plan is Good?
This what I love about this software – the graph tells you right away whether your retirement plan is a good one or a bust.
The goal: Neither light blue or dark blue should run out of money by the end of your graph (right side).
Ideally it would be great if you could construct a scenario where even your worst returns (dark blue) still show you living well into a ripe old age and not once running out of money.
If your probability is less than 100%, you’ll get a score (out of 100) that will tell you what your probability for success will be.
I know I had to go back a few times and adjust my plan to make even my worst case scenario portion a success.
How Did My Retirement Plan Do?
To really test this software, I decided to use the numbers from my own retire early by age 45 plan and plug them in to see what I get.
The result – As you can see with the images I used above, my retirement plan appears to be in great shape!
Then for fun, I decided to see what the likelihood would be of getting an extra $1,000/month for early retirement. After making a few adjustments, here’s what I got:
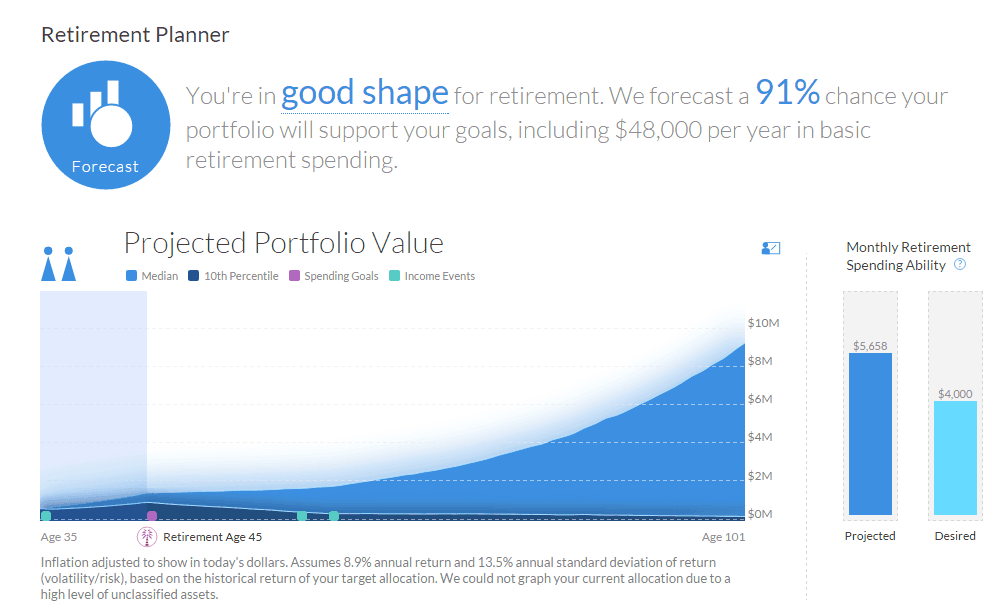
It looks like the odds are pretty good! Perhaps maybe my early retirement could be a little fluffier than I thought!
Learn Something New
You’re never too old to stop learning.
One cool thing I learned while playing with the sliders was that if I wait until age 70 to start receiving Social Security instead of age 62, I’ll actually (in theory) end up with LESS possible money in the end! – Almost by $2 million dollars!
Who knew?
Back many years ago when I did a deep dive into Social Security and how it all works, I assumed that waiting as long as possible to start receiving payments was the right way to go. You can read all about it in a two part post I did here and here.
However, now playing with this calculator, my mind is open to a different possibility!
Critiques
Of course nothing is ever perfect, and we can all use some room for improvement.
My one major criticism of this calculator is that you can’t change the investment return parameters. By default, the software automatically assumes that you are only investing in a stock market index fund (like the S&P 500) from now until the rest of your life. While that’s not a terrible assumption, it’s unfortunate because not everyone is comfortable with stocks.
- What if you take a more conservative approach and go the old 60% stocks / 40% bond route?
- What if you’re ultra-scared of investing and only want to invest in government bonds?
- What if you just want to make a point to a friend or client by showing them how a more aggressive portfolio might do them some good?
It sure seems like they could add in an option to select one of 4 or 5 different types of investors and then have the investment returns change based on that selection.
Give It a Try Yourself
All in all, like I said above, this has got to be one of the most user-friendly, comprehensive and best retirement calculator tools I’ve ever seen online.
The visual reference of the multiple simulations mixed with the ability to change the different variables at the flick of a button put this in a league way beyond other online calculators that are out there.
I highly encourage you to go on over to Personal Capital, create a free account, and start playing with this thing today. On top of cool net worth tracking software, you’ll get to see your retirement strategy in a whole new light and possibly learn something that you need to know about your plan. That’s not a bad return at all for taking 5 minutes to start a free account.
Readers – Try out this retirement planner and tell me in the comments below how your retirement plan worked out. Was it a success, or did you have to make some unplanned adjustments?
Featured image courtesy of reynermedla | Flickr


I have heard lots of good reviews about this retirement planner, MMD. I am so excited to try this out and will surely let you know my experience and the results I got. Thank you for reminding me of this.
It was definitely one of the more fun and interesting ones I’ve tried in a while. It did in a few clicks what it takes me forever to do with spreadsheets.
I’ve been very impressed with this planner. I love that you can add tons of variables, and you don’t have to assume that you’ll need 80% of your current income in retirement and that you’ll retire in 30 years. Like you said, no calculator is perfect, but I agree that this is the best one I’ve seen. .
I was almost overwhelmed by how many extra variables you could add, both on the inputs and expenses. That’s some really good customization.
Thanks for sharing about this tool! I was very excited until you got to the investment return assumption at the end… Maybe they will update it to take into account various asset allocations. I will definitely check it out, though.
It sure seems like an update to that section would be pretty simple. They already have a drop down menu with 5 options ranging from “conservative” to “very aggressive”. Based on what you choose it could then use a new variable to use for your average annual return rate.
They should just consult with me and I’ll set them straight 🙂
Very helpful calculator. It is always a good idea to check your numbers from time to time and see if you are reaching your financial goals. It also gives you some confidence that your are heading in the right direction.
I agree! Although none of these calculators may be perfect, if you put your plan into enough of them and it tells you that you’ll be alright, then that should give you some confidence.
I love playing around with the different retirement calculators. Unfortunately, you always seem to get different results as each one contains different assumptions and factors. This is a great one though. Thanks for the great post!
Isn’t it funny how each one has a unique approach with its own set of variables? Do enough of them and if you’re successful, then you’ll know your plan is a winner.
It seems like Personal Capital is truly providing good value for no cost. I am always looking for some good old fun hypothetical calculator to predict my FI date. Thanks for the detailed review.
Personal Capital is practically giving away software that Quicken used to charge $50 for years ago. Given enough time technology will reduce the price of just about anything.