In order to really compare each of these options side-by-side, the best way I can think to show this is to graph them over the course of many years starting with Year 0 at retirement. Starting at Year 0, some of the options will cause us to either have more or less money built up at the start. Then with each passing year of pension income, we’ll see how long it takes for the TRUE winner to reveal itself.
My SB1040 Results (Savings Account Model):
Let’s look at the numbers if we assume we just banked the differences in MIP payments in our savings account paying 0% interest. To keep things simple, we’ll ignore inflation and chart Option 4 starting with the other accounts at Day 0 (even though you’d have to wait until age 60 if you don’t have 30 years of service credits).
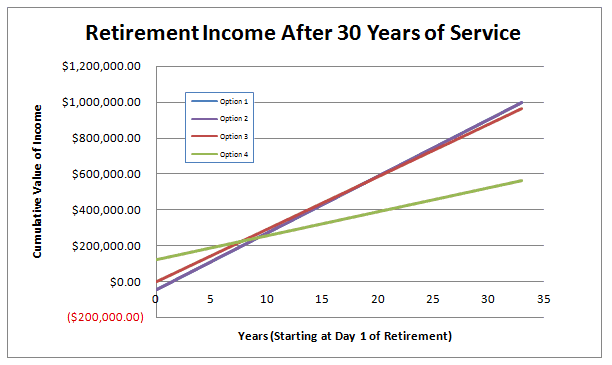
With these things in mind, the total cumulative income of each of our SB1040 options starting at Day 1 of retirement would look like this:
Option 1 (Blue Line) – This is clearly the best option over time. Given that the life expectancy of a female in U.S. is about 81 years and my wife plans to retire at about age 48, that means our retirement income would need to stretch for about 33 years.
Option 2 (Purple Line) – If you can’t see this one, that’s because it had exactly the same result as Option 1 since my model assumes we retire right at 30 years of service.
Option 3 (Red Line) – The lower pension, same MIP contribution follows suite with Option 1 very closely, but it only takes 12 years for Option 1 to overtake it.
Option 4 (Green Line) – This option is clearly not favorable for my wife’s situation.
First of all, don’t be fooled: We wouldn’t really have this money starting at age 48 (when my wife hits 30 years of service credit) because she wouldn’t GET this income until age 60 (because this Option froze her pension account at 15 years of service credit).
Over the long haul, that steep decrease in pension payment would really start to lag behind our other options.
And keep in mind that we’re assuming we’d be receiving health care because we had 15 years of service credit. IF WE DIDN’T, we have to pay all that insurance out of pocket! So we’d have even less money!
My SB1040 Results (Investment Account Model):
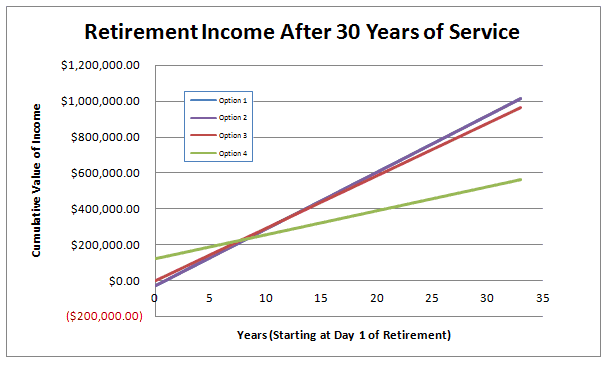
Now instead of putting the difference in MIP payments into a bank account, let’s assume they would have been invested and returned 8% each year. When we do that, our cumulative retirement income would look more like this:
Again, Option 1 is still the more favorable option in the long run. However, it does take almost 20 years until it overtakes Option 3 (which follows it very closely).
Option 4 is still the least beneficial choice for my wife’s situation over the long haul.
My SB1040 Results – An Example Where We Work More Than 30 Years:
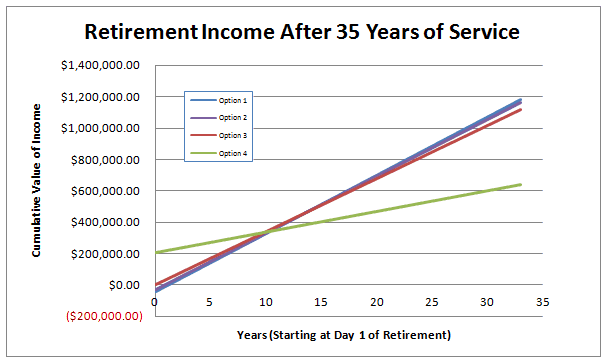
Working more than 30 years is always going to be an option for us. So for our own benefit as well as to illustrate the difference between Option 1 and 2, here is what the graph of the SB1040 Options would look like assuming we work for 35 years and simply save the difference in a savings account.
Again, Option 1 is the winner over the long haul. It only takes 11 years for it to beat Option 4 and 12 years to beat Options 2 and 3.
However, there is not a ton of difference between Option 1 and 2. Even if after running the numbers all the way out to 33 years of retirement, the difference in total cumulative income is only about $19,000.
Factors that Would Affect YOUR SB1040 Choice:
I realize that not all of you are my wife. You might find TOTALLY different results if you ask yourself:
• How long have I been working – did I just start or do I already have 25 years into the system?
• Do I plan to work longer than 30 years?
• What if you’re older in age than your colleagues?
• What if the stock market doesn’t return 8% like our assumptions show? What if the stock market only returns 0% like it did during the Lost Decade of 2000-2010?
• What if you don’t need to purchase health care because you’re going to be covered by your spouse’s plan?
• What if you’re terrible at saving money, and don’t plan to save or invest the difference in MIP contributions?
• What if the State decides to change the Pension plan YET again and reduces it even further, even after you commit to one of these options?
Remember that the decision of which SB1040 option to go with is irreversible. I sincerely encourage you to run the numbers and see for yourself how each of these factors will influence your decision!
Readers – Which SB1040 option did you think would yield the most return? How would you have approached this problem? If you are an educator, which one would you have chosen?
Post Series Chapters:
1. SB1040 Pension Plan Options – Introduction
2. SB1040 Pension Plan Options – Option 1 & 2
3. SB1040 Pension Plan Options – Option 3
4. SB1040 Pension Plan Options – Option 4
5. SB1040 Pension Plan Options – Conclusions
Image Credit: Microsoft Clip Art


Thanks for this, Michigan teacher trying to figure it out. Kinda sad, I make far less money than I did 5 years ago but I’m working more and more, now less retirement and more cost, worse health insurance at more cost. Gee, feeling pretty valued, so glad I’m paying the union $27,000 of that dwindling money to “help’ me.
I feel your pain. I’ve watched my wife get only a fraction of what she is supposed to, her health care get cut, and more and more piled on. I don’t blame the Unions. Even though I wish they were stronger, I’m afraid teachers would be making minimum wage by now if the State had their way. What I really blame is the culture of our State that constantly belittles the work and role of teachers. We’ve got too many people believing that teachers don’t work hard enough, and they couldn’t be any more wrong.
Well, better late than never, I did an analysis of your pension options this morning. I took a somewhat different approach than your analysis, but arrived at the same conclusions.
I didn’t bother to analyze options #2 and #4, as you indicated that for various reasons (e.g. length of service, health insurance), these options do not meet your individual situation.
Comparing options #1 and #3, I only looked at the differential. For both options, whatever years you’ve already worked are credited at 1.5% of salary. Hence, the difference is whether contributing 7% going forward to receive 1.5% salary payout (option #1) is better than contributing 3.6% going foward to receive 1.25% salary payout. Or put even more concisely, is 3.4% extra salary contribution worth 0.25% extra salary payout.
In other words, can we take that extra 3.4% and construct an equivalent lifetime annuity of 0.25% x years service at retirement? To compare apples to apples, I think we should use guaranteed rates. Yes, the market might return 10% a year or -5% a year, but that is not a fair comparison. So I would use a 3% investment rate, as that’s close to GIC rates or long term treasuries. I’d also annuitize the amount at retirement with current annuity rates.
So to use some numbers for a back-of-the-envelope calculation, I’ll assume 15 more years of work and retirement at 50. Future Value (FV) of 3.4% * salary at 3% for 15 years = 63.2% of salary. Typical immediate annuity rates right now for 50 year female would be 4.7%. Hence, you would be able to construct a lifetime payout at 50 of 0.632 * 0.047 * salary, which is almost exactly 3% of salary yearly payout for life from option #3.
For option #1, you have 0.25% * 15 (years) * salary, which equals 3.75% of salary for life from option #1. So right off, option #1 appears better. BUT…it’s actually a LOT better because you indicated that the pension is inflation adjusted, so we would have to use a much lower annuity percentage for option #3 to make a fair comparison. (There are CPI-adjusted annuities, but I don’t have a convenient free source of such quotes. However, obviously CPI-adjusted rates will be much lower.)
And if there is any silver lining to this whole mess for you, it should make you realize what a good deal the original pension is for you. If another 3.4% contribution was still worth the extra 0.25% yearly payout factor, imagine what a good deal the original 3.6% is giving you – a 1.5% yearly payout factor, or a 1.25% factor going forward!
SB, thank you for this very in-depth review of the options! I like the route you took for your analysis, and it sounds like we came to the same conclusion = Go with Option 1! I can tell you that the deadline for selecting your option has already passed, and we opted to go with Option 1 for the reasons we laid out. Assuming nothing changes over the next 13 years, it is such a better deal! Thanks a lot for this very thorough review of the options.
Here is a thought. We live debt free house is paid off I have 20 years of service. So far I’m signed up for option 3. We put 15 % of every pay in retirement. Thanks Dave Ramsey ! I think keeping my pay the same for the 10 years or more since I’m only 41 I can teach awhile will be better for me. I can invest that extra pay in something else and not send it to Lansing. I don’t like option 4 because I don’t have enough time to build that up. I have a feeling this winter they are coming back after us in Lansing with crooks like jase Bolger