For anyone who doesn’t remember, the 3 Percent Signal was an interesting concept where you effectively buy or sell shares of an ETF to effectively lock yourself into a 3% gain per quarter.
I, unfortunately, somewhat fount this strategy to be a bust when I tried to validate it by reproducing the results.
At its basic level, I do believe there is some merit to a “buying or selling stocks when the price is low or high enough” theory. After all, isn’t it all just math; small gains here and there that add up over time?
Perhaps so. But the problem that I’m sure you and I both have is knowing exactly when is the price truly low.
“Low”, of course, is a matter relatively.
It’s very simple to look at the current price of an investment, look at its history, and see that it is in fact “low” and perhaps a good opportunity to be purchased.
But is that really enough to “beat the system”? Could beating a market index really be that simple?
Building My Test – The 10% 12-Month Signal
I decided I would test that theory (on paper at least).
With the same Excel spreadsheet I had used for the 3 Percent Signal fresh on my PC desktop, I decided I would concoct my own hypothetical “signal” scenario. This would was just about as easy as it is ever going to get: Buy when the investment is 10% or more lower than 12 months ago. Let’s call it the “10% 12-month” signal.
I decided to test this using the same vanguard small cap NAESX mutual fund that I tested in the 3 Percent Signal.
The “Signal” process would go like this: Every month that the fund drops 10% or more below its price from exactly 12 months ago, I’ll buy $1,000 worth. If it’s less than 10% or gains value, I will do nothing.
As a benchmark, I’ll compare my results to that of someone who simply took that same amount of money and on Jan 1st bought however many shares they could purchase. So for example, in 2001, if their friend using the Signal strategy invested 5 times at $1,000 each for a total of $5,000, then this guy in auto-pilot mode would simply also match that investment of $5,000 on January 1st, 2002. We’ll call this the “No Signal” approach.
What Happens After 15 Years?
To start our analysis, I decide to look at data from the years of 2000-2015.
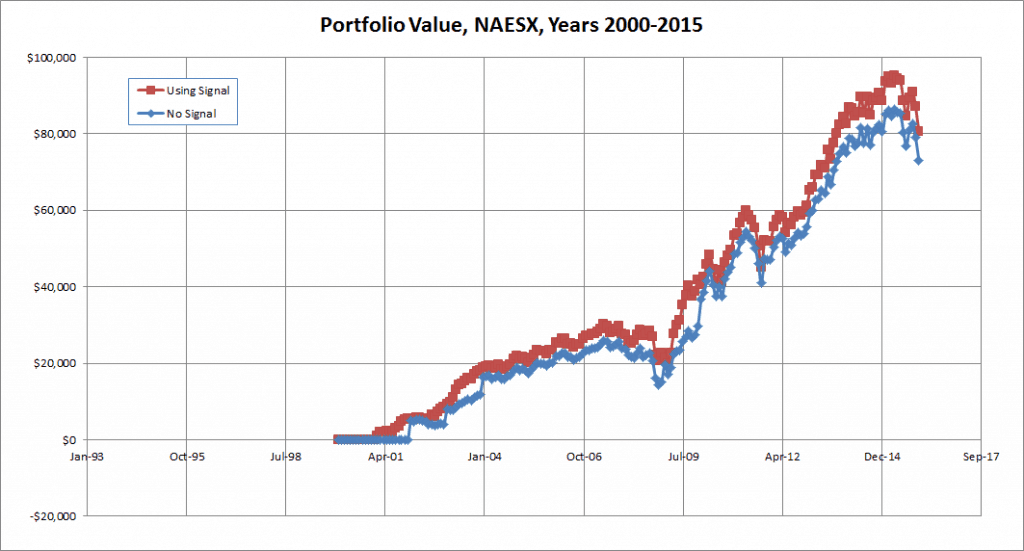
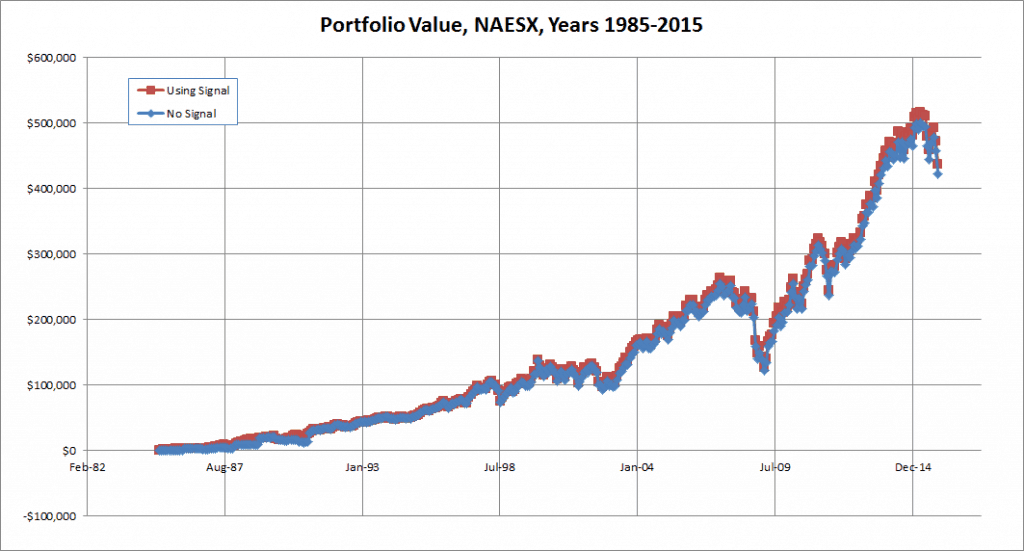
At first glance when you look at the two graphs, you notice … nothing profound. Although the Signal strategy tends to do a little better than the No Signal one, they seem to follow the same market trends up and down.
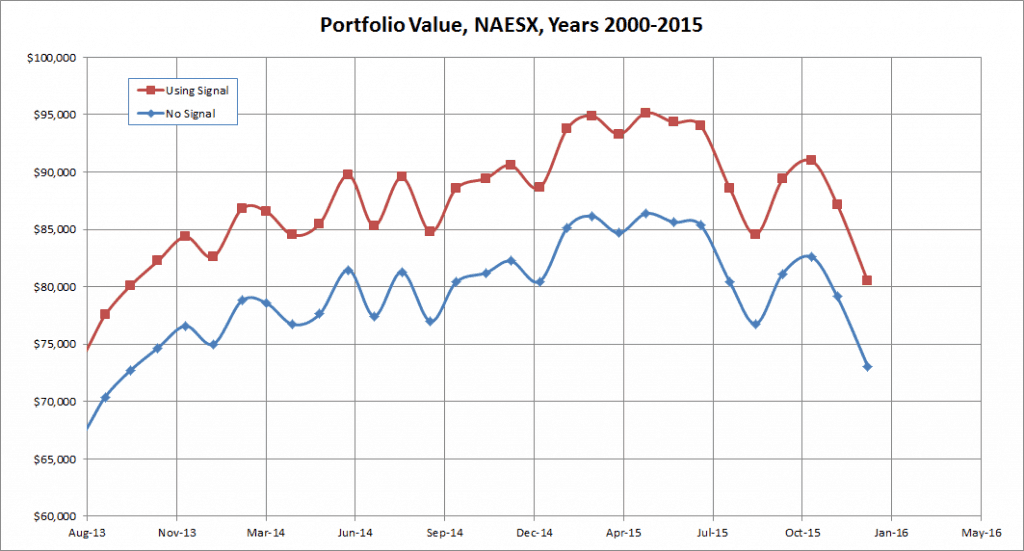
Zoom in a little bit more on the last year of the two graphs. Notice that the “Signal” one (red) is just a bit higher than the benchmark (blue); about $7,414 more ($80,492 vs $73,078).
While $7,414 is not exactly a ton of money, it is a difference to note. When you quantify the return on investment over the past 15 years, you get an annualized rate of 11.3% with the Signal and 10.5% with No Signal. That’s practically almost a full percent more!
Could we be on to something?
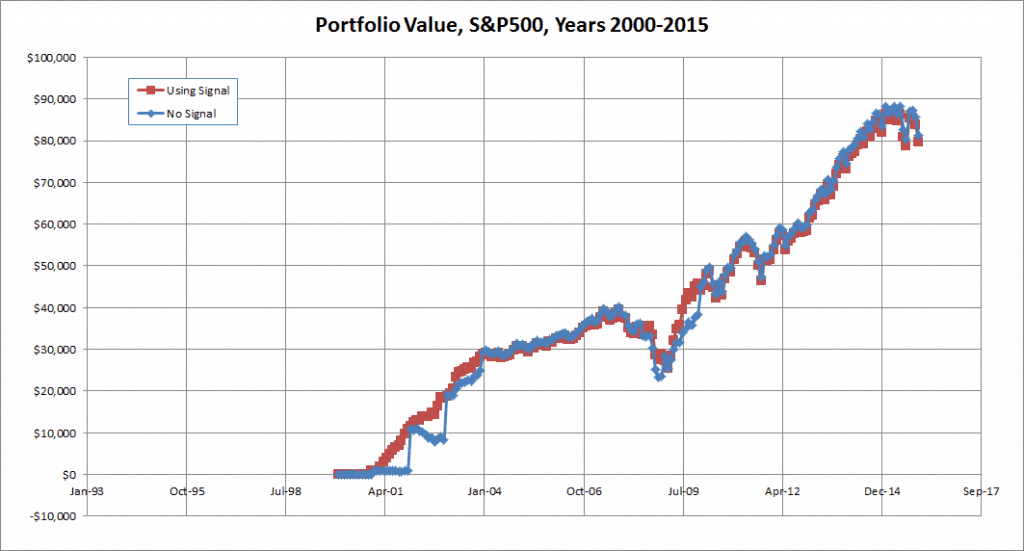
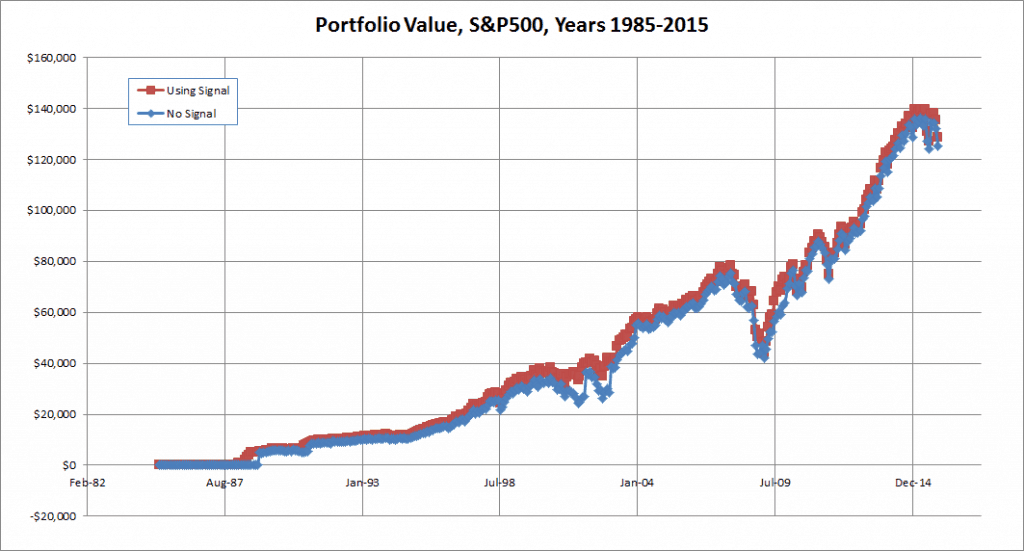
Knowing that the small cap index is considered to be somewhat “risky”, I decided I’d try the same process on the S&P 500 Index.
Unfortunately, the end results were not quite as well spread. Between the two strategies, there was actually a decrease of $1,674 when you used the Signal strategy. So not only is the difference not distinct, it’s also not to our benefit.
What Happens After 30 Years?
Let’s turn our attention back to the small cap index.
Could that spread of almost 1 percent between the two strategies continue on if we continued this study with 30 years of data?
I again ran the simulation and, unfortunately, the spread closes. This time, the Signal strategy ends with $13,765 more than the No Signal strategy. But over 30 years, that is not a very significant amount of money; only $436,134 vs $422,369. The annualized rate of return calculates to almost identical: 9.7% vs 9.6%.
Even though we already know the S&P 500 will not work, I did the same calculation with 30 years of data as well. The two strategies again will give you almost identical results: $128,614 vs $125,185. So, again, there is almost no difference whatsoever.
Conclusions
With those 4 simulations, I believe I can safely conclude that trying to time your investments based on buy and sell signals for stocks has almost no benefit at all over the long term. You’d do just as well to go into auto-pilot mode and buy whatever assets you plan to buy on January 1st versus all the trouble of watching the markets month-to-month and trying to out-smart the system.
To remain humble in this investigation, there are a few things I think I could do to further develop it. I only ran one block of 15 years and one block of 30 years. Perhaps if I chose rolling data sets from several rolling years of 15 and 30 year periods, I might uncover occurrences where this strategy worked.
The other thing I could do is investigate other types of investments. The small cap index and S&P 500 index are relatively popular ones and easy for people to relate to. But they are not the only two investments in the world. There may be other examples to explore.
Readers – How many of you have tried your own “signal” experiments? What kind of successes or failures have you had with trying to detect such patterns?
Featured image courtesy of Flickr | Thomas Hawk


Ultimately, I don’t think there are any “tricks”, outside of precognition and insider trading. Nothing beats the power of years worth of compounding.
I think the Signal strangely probably did better on the small cap index than the S&P 500 due to volatility. I assume there was more volatility, and thus more buying opportunities and more opportunities to sell and lock in those profits. How often is the S&P 500 really going to swing 10% in any given direction over the course of a year?
Sincerely,
ARB–Angry Retail Banker
Exactly. This is just more proof that indexing triumphs all!
I’ve explored, and even implemented, a few mechanical investing strategies over the years, including backtesting by various tools. I’ve always been disappointed.
They always look great on paper. But when the rubber meets the road, they fail. Between transaction costs, the human factor, and the unpredictability of the markets, it wears you down in the end.
Now I stick to buy and hold, and focus on reducing costs, and dollar cost averaging.
I’m completely on board with buy and hold, and DCA! Less complication is becoming a gain in and of itself!
Love the work done here to truly test out your hypothesis. As you found I think the best thing to do is develop an investment strategy you’re comfortable with and stick to it over a long period of time. It is increasingly difficult for someone to consistently beat out the market
Thanks! I’m very big on running the numbers and seeing what we get. The more and more time goes on, the simpler and simpler I like to keep my strategy. I’m also becoming less pre-occupied with trying to beat the market and am more satisfied just to keep up with it.
That’s good info and I expected a loss with the strategy. Buying and selling has so many downsides to it. Good luck and keep up the work.
Thanks! I had my fingers crossed, but already had a hunch that it wasn’t going to work. There’s a small part of me that thinks that if a strategy such as this existed and was successful, someone would already know about it.
I don’t know if there are signals per se to buy / sell stocks, in a very accurate fashion. Also if the buy/sell become too frequent, I suspect that trading costs would negatively impact the results vs buy and hold.
However, as Warren Buffett says, there are times where the market is expensive and times when it is more affordable.
According to this theory, with a time horizon of 10 years, investing in stocks these days would be less interesting than investing in bonds, even if none of them are very exciting investments right now. But only time will tell.
I think buy and hold is a great strategy and I think that 40 years from now, we would agree that buying today was great timing 😉
As the old saying goes: The best time to plant a tree was 20 years ago. The second best time is right now!
I always look back at pretty much any set of market data and wish I had invested right at the beginning. By the time the graph makes it over to the right side (present day), it’s a lot more than what you started with!
Interesting. Signaling seems like, logically, it could help remove the emotion from trading decisions. Just comes down to really, REALLY honing in on your algorithm. I’ve been meaning to try Quantopian specifically for this reason, but need to learn how to code first! I feel like the ideal signal would include some fundamentals, but mostly technical aspects, since the intraday price of a stock is significantly affected by buying and selling decisions, and could say a lot about sentiment. Thoughts?
I agree with a previous commenter who said that signals just take emotions out of the equation. As investors, we’re only as good as the tools that work for us, which for me has been a fully non-emotional approach to what to buy and what to sell. Early on, I was more likely to buy more of what I was excited about. At that time, you can be certain that signaling was a better alternative than relying on my own instincts.
Today, I look at historic volatility. Less volatile investments get more of my money and more volatile investments get enough of my money to get me in the game.
I totally hear you! The longer I invest, the more I gravitate towards safety. Boring is beautiful as long as I’m seeing returns!