I’ll admit it – this book was scratching me right where I itch! I’m a huge sucker for mathematical-based approaches to investing and optimizing your personal finances. (When I say that, someone like Michael Kitces or Wade Pfau comes to mind.) If you’ve got the right numbers and figures to provide as evidence for your strategy, then I’ll have no trouble giving your research an honest, worth-while listen.
More so, even though I recognize and believe in the power of index fund investing, I’ve often thought to myself that there has to be other, more strategic ways of coming out ahead of your peers. Take, for example, the simplicity of compounding returns. Isn’t this just a mathematical way of growing your money way above and beyond anything you could ever save on your own? Perhaps there are other similar strategies – it doesn’t hurt to dream, right?
Honestly, when I got all done reading The 3% Signal, I was ready to sign on the dotted line! Having just sold our old house, we’ve got a nice little bit of cash sitting in our savings account. I’ve been gung-ho to start putting it to work!
But before we jump into the 3% Signal strategy with both feet first, I have to ask the all-important question: Does it really work? I mean, like, really work? I’ve read plenty of other books in the past that made some pretty amazing claims about grand returns you’re going to make using their advice. But when I looked under the hood a little bit more carefully, I didn’t like what I saw.
The 3% Signal strategy deserves no special treatment. Just because the author offers us his back-test data does not necessarily mean we have to accept it at face-value. At this stage of my investing career, I rarely do anything with my money any more if I can’t first put some realistic numbers into Excel and convince myself that the plan is going to work first (or not).
(On that note, a quick side-story: Last year, I was actually all set to buy my first rental property! BUT, after running the numbers, I ended up not moving ahead with it. I decided there were other, better opportunities to make a higher return more quickly.)
In this post, I’m going to share with you my personal analysis of the 3% Signal strategy (which we’ll abbreviate from here on out as “3Sig”).
Can You Really Artificially Lock Into a 12.6% Return?
The first thing that struck me about the 3Sig strategy is that, on the surface, it offers to lock you into a return of 12.6% every year. That’s what 3% per quarter (as the strategy calls for) is when you compound it throughout the year.
But here’s the thing that bothered me:
- If there’s a bond portion, that’s not getting 12.6% year. So the total return has to be lower. Kelly’s data in Table 15 (p. 89) suggests its 9.1%. But what if its less?
- If you infuse cash every so often (as Kelly offers both data with and without), then the overall return should again be lower because that cash hasn’t had sufficient time to compound. Again, Kelly states in Table 15 that it should return a whooping 10.4%! But this seems too good to be true.
And one more thing:
- Why is the data only from December 2000 to June 2013? (I’m assuming Kelly really means 1/1/2001 to 7/01/2013.) Is the last 12.5 years really enough time to make a sound judgment as to the effectiveness of this strategy?
I decide the best way to tackle each of these suspicions was to download the same data he used (available on Yahoo Finance) and try to recreate the results in Table 15.
If I’m successful, then I should be able to use other sets of data that go even further back. That way I can back-test this plan by +20 years.
So how did that all work out?
My 3% Signal Results (Using the Same Data as Kelly)
After working out an extensive Excel spreadsheet taking into consideration small nuances of the plan such as the “30 down stick around” rule and the rebalance to 80/20 when your bonds get above 30%, I was able to come up with some results.
Here are my results compared to Kelly’s Table 15 results:
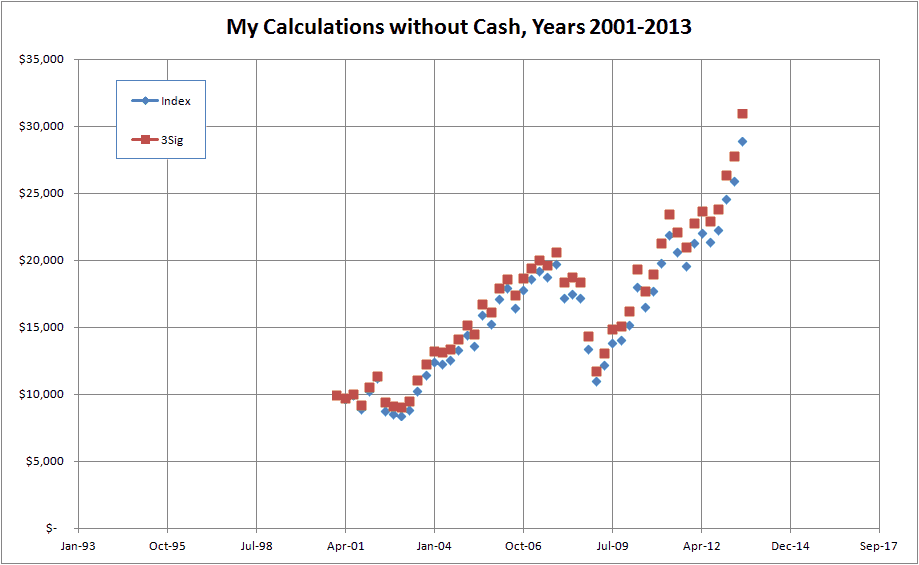
- With no new cash invested, Kelly got $29,760 with the 3Sig plan and $27,289 with a traditional buy and hold strategy using only IJR.
- My calculations under the same conditions came close: $31,009 with 3Sig and $28,907 with just IJR.
Not a horrible comparison, but not exact either. In both cases (Kelly and me), the 3Sig strategy came out ahead.
Now, here’s where it gets interesting.
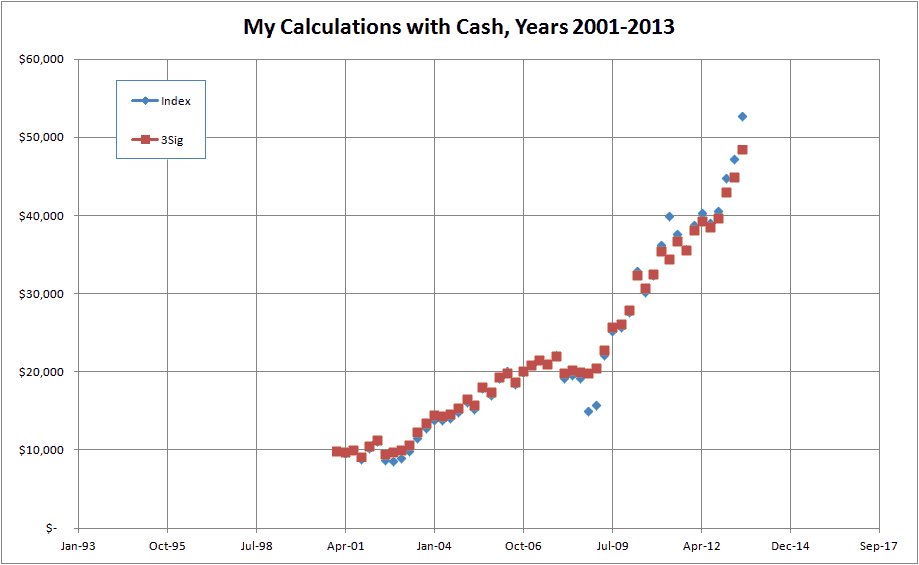
When you DO add in cash every time your Bond fund runs out of money, Kelly and I get very different results:
- Kelly got $85,721 with $27,249 in cash injected into the plan. Again, that’s a return of 10.4%.
- My 3Sig calculations resulted in $48,536. I only added $9,532 of new cash into the plan. And my return was 9.6%.
Naturally because you have to have the same amount of cash to make this an apples-to-apples comparison, my calculations for the Index alone plan with cash infusion do not match Kelly’s results:
- $52,739; a 10.5% return
- Kelly’s $78,105; a 9.3% return
This is interesting. The results of my calculations seem to suggest almost the inverse of Kelly’s findings!
I can only think of one logical reason why this could be:
- One of us is wrong.
Admittedly, it could quite possibly be me. My calculations are based on my understanding of Kelly’s method to the best of my understanding. By the way, if anyone would like a copy of my Excel document to try to work with me on this and investigate these findings further, feel free to email me. I’d love to get a second opinion.
If I am wrong, then is this strategy really so simple and straight-forward? I’m an engineer who deals with data all the time. If the 3Sig strategy is really so easy to use, then I should have had no trouble reproducing it with little effort.
What Happens When We Add More Years of Data?
Okay, so let’s table the fact that Kelly and I got different results.
Let’s now address the issue of Kelly’s data being only from the last 12.5 years. Quite frankly, one clip of data that is only 12.5 years is just not enough evidence for me to hang my hat on.
Kelly says he only used this time frame because that’s how far back the ETF’s go. Okay. I’m going to work around this by using two similar mutual funds that go back even further:
- Small cap stocks = Vanguard Small Cap Index Inv (NAESX)
- Bonds = Vanguard Interm-Term Bond Index Inv (VBIIX).
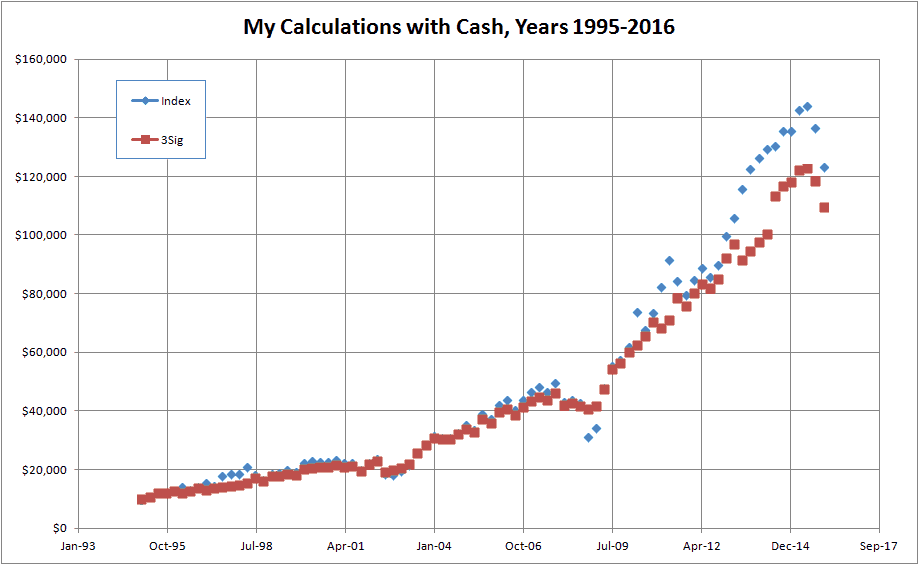
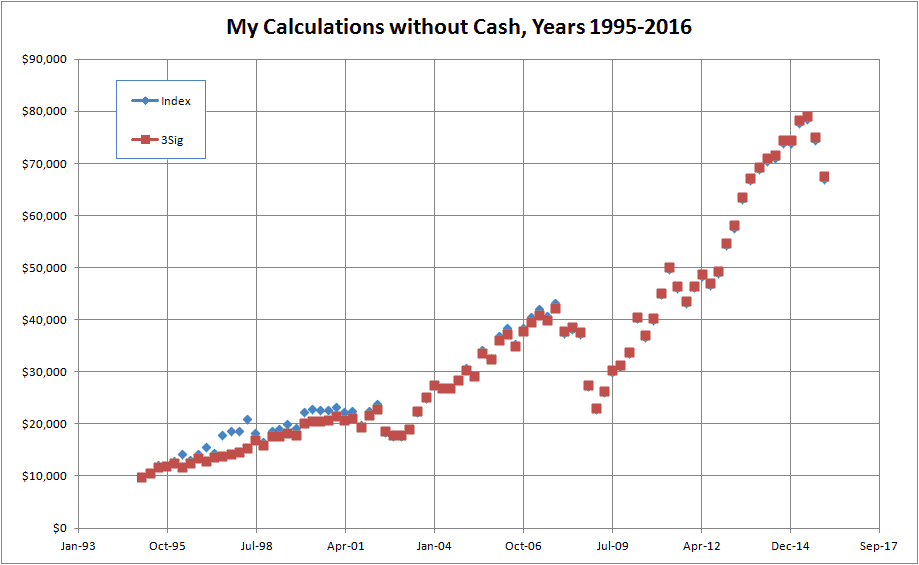
Using these funds gave me data that goes all the way back to 1994. Working my way up to 2016, this gives me 21 years of test data. Not a huge amount of data, but certainly better than 12.5 years.
Again, using the same rules that Kelly outlined, I came to the following conclusions:
- When extra cash was added, the Index only approach beat the 3Sig approach $123,383 vs $109,553. It does a pretty good job up until the great recession of 2009, and then it never quite keeps up pace; trailing by almost $20,000 at times!
- When no extra cash was added, the two strategies basically start to mirror each other. $67,801 3Sig vs $67,294 Index. This is because without any new cash, the bond eventually runs dry. Then you’re effectively left with a 100% stock fund; the same thing as the Index approach!
Again, in both analyses, we see that the 3Sig method doesn’t necessarily give us any specific advantage. In fact, in the cases where extra cash was added, we actually end up with lesser balances!
What Can We Conclude About All of This?
So is there any benefit or merit to using Kelly’s 3Sig strategy?
In short, yes.
Although you don’t necessarily end up with more money, there is one thing to be said about this approach: It does produce stability.
Let’s say you were in the retirement phase of life and living off of your investments. How would you feel about your money fluctuating wildly up and down with all the noise of a small-cap index fund? I know I would not feel good about that!
In contrast, the 3Sig strategy does help to reduce (but not eliminate) these wild spikes in losses. We as humans are emotional based, and some stability can do us good.
So in summary:
If you’re in the accumulation phase of life, you’re probably better off just going with the Index approach. The bumps and blips you’ll feel along the way may be rough at times, but you’re more likely to end up with more capital when all is said and done.
While you’re in the retirement phase of life, the 3Sig approach may have more usefulness now that cash preservation may be more important than capital building.
Technical Notes:
On the issue of adding additional cash every time your bond fund runs dry, I didn’t really agree with the way that Kelly presented this data. In the Table 15 (p. 89) where he compares the plans, in Plan 1 he assumes you started off and invested on Day 1 all of the cash ever needed over the course of the 12.5 years. This is unrealistic, and I believe Kelly even dismisses this idea later on in the text.
Take Kelly’s Plan 3 for example. In this one, all the cash that is added throughout the course of the 3Sig plan (Plan 2) is totaled, divided over the 50 quarters. This, again, is unrealistic. For a person just starting this plan today, how do you know how much “extra” money you’re going to need in order to make an accurate comparison 10 or 20 years from now?
Therefore, for my calculations, I took a slightly different approach. And I believe that my method actually does a better job of giving a true Apples-to-Apples comparison.
In my analysis, every time you added in additional cash to the 3Sig plan for a specific quarter, you also bought the same number of additional shares in the Index Only approach for that quarter. This way, fair-is-fair. Each quarter, you’re not adding cash to one plan but not the other.
I also believe this small change contributed very little to the differences in results I calculated versus Kelly.
Readers – What do you think? Are you sold on the 3% Strategy, or do you believe there is more to this investment strategy? What other investment strategies have you investigated on your own only to find very different results than what the author had presented?
Photo credit: Flickr


AS of right now, I am not focusing on bonds in my allocation. SO I just am building on my equity exposure, and as I get older will build bonds to diversify risk. I want funds that grow in price as well as provide me a growing dividends base. Bond funds I have had in the past seem to stay level price wise, and I don’t like that.
Nice review, MMD. Kelly’s explanation is I think unrealistic. And, I prefer your method MMD. It shows results I may expect later on and more realistic.
Dear MMD,
I am interested in the investing into ETFs (S&P500). I read articles on your site about ETFs but I could not find any artical about regular investment (e.g. monthly, quarterly…). For example: I have 10.000$ for the investment. Is it better to put monthly 1.000-2000$ or do the whole investement at once? If you have any free money for the investment, are you checking “buying signals” or investing immediately?
Sorry for my English.
Hi Jan. Welcome to the site. Sorry about my late response. In general, I tend to go with the theory that its always “best to invest right now”. I don’t really try to time the market or look for signals (although after reading the 3% signal, I have been playing around in Excel with a few theories I’d like to test). I just simply dollar cost average my retirement savings, and make larger investments if I happen to come into larger sums of money.
I found the 3sig to risky for me. By that i mean the extra cash required in a down turn of any significance. I have used AIM for several years with only two ett’s, QQQ and a bond fund. For me the results are quite similar and I have never needed additional cash..
Thanks for sharing.
Would you please share more info on your strategy? Thanks!
Hi – Just read Kelly’s book and your comments above. I too worked extensively in mathematics as a Professor of Meteorology (not finance, which would be evident if you saw my investment strategies :). I always thought that ts may be possible to devise an investment scheme which takes advantage of market volatility. So, when I read Kelly’s book, I was also intrigued. I had to convince myself so I programmed a spreadsheet as you did and found similar results. This time I had 2017 to add. By tweaking the the variables, i.e. the %, stock/bond split and the stock (or ETF) itself I could find results which would have made me a billionaire. Unfortunately, I would have to had known that the stock market would behave in a particular way (sound familiar?). I used monthly data to see if a higher frequency would difference (not really) and 1%/month with an 80/20 split.
I’m retired and don’t have $ to input into a depleted bond fund. I found that the scheme really didn’t do any better than buy and hold. I could make outperform by changing the % variable. That makes since given the 17% rise in stocks in 2017. Thus, my conclusion was that the best way to make money in the market is to know which way it is going to vary in the future.
I have the spreadsheet in Excel format. If anyone is interested I’d be happy to send them a copy and you and see where I went wrong.
P.S. my past research interests were in validation techniques for climate models
Thanks for the informative and well written article. Jason publishes a monthly tally of his results using his 3% Sig Plan which seems impressive. But like you say, it would be nice to be able to look under the hood to see exactly how much cash Jason’s had to add to the plan to keep it going, and when.
With regard to using the 3% Signal during retirement, does the retiree simply ignore the need to infuse cash into the bond fund when it runs dry, or somehow find the cash and throw it in?
I just finished the book and I’m the middle of my own spreadsheet, but there’s one detail in the math that doesn’t make sense to me. He says to buy the value lost or made compared to 3%. What if a quarter made money overall, but ended at a price under the 3% line – it seems like he suggests you buy at that time (3rd quarter on his graph on page 38 for example), but given there is a total positive amount of money made for the quarter, how much do you buy? I’m in the middle of redoing all the calculations for myself too, but I’m wondering if anyone knows this, or if there’s a part I missed in the book (he’s not a great author and repeated himself constantly, so I skimmed a lot…)
Excellent review of Jason Kelly’s 3% Signal.
Question:
Were you able to back test this strategy to buy the equity, IJR, only when the equity went DOWN 3%?
Again, thanks for the review.