So how do we evaluate a company’s stock metrics to know if it will be a good investment? Fortunately, all this basic information you need to understand a potential prospect has been summarized by most major news outlets into single, bite-sized profiles that are convenient for you to access and are constantly updated.
The goal of this post will be to walk you through one of these pages of metrics and explain how to read stocks. For this exercise, I will use a stock that I own, Johnson & Johnson, and a news media that I often use, CNN Money. Keep in mind that you could find similar stock metrics and other variations just as easily on Yahoo Finance, Google Finance, MSN Money, your broker’s website etc. (CNN Money just happens to be the one I use the most)
Top of the Page:
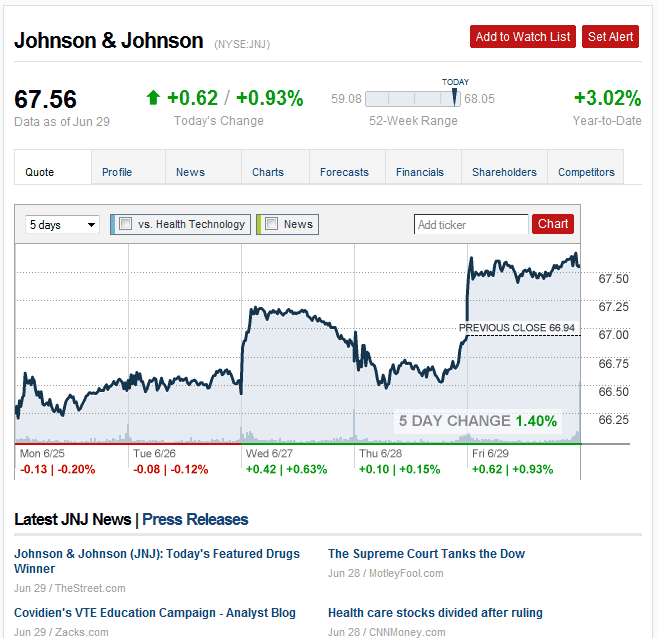
• Ticker: The ticker symbol of the stock and which market it trades on.
• Price: The price that one share of stock is trading at. This price will change in real-time all throughout the day while the market is active
• Today’s Change: The difference between the price today (now) and the price yesterday at closing, expressed in both dollars and a percentage.
• 52-Week Range: The spread between the maximum value and minimum value that the stock has reached over the last 52 weeks (year). If the stock is at the higher end, it could mean the company is on a rising trend or possibly that the price is becoming over-valued. If the stock is at the lower end, it could mean that company is declining in performance or that possibly the price is becoming under-valued.
• Year-To-Date: The percentage that the stock price has changed since Jan 1st.
• Chart: The chart shows the fluctuation in price of the stock as it moves throughout the day. Believe it or not, a chart is very helpful in learning how to read stocks because it helps to reveal trends and other useful information. The chart has options to change the length of time and add other stocks for comparison.
• Latest News: Any relevant news stories about the company are displayed here. Want to know why a stock is suddenly rising or rapidly falling? There might be a news brief about it here.
Today’s Trading:
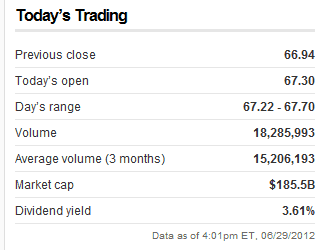
• Previous Close: The stock price as of yesterday’s close.
• Today’s Open: The stock price as of the market open today. Note that the price can change overnight due to after-hours trading.
• Day’s Range: The highest and lowest prices that the stock has traded for today.
• Volume: Tells the number of shares that traded for this day. You can compare it to the Average Volume to see if the stock is trading more or less than usual.
• Average Volume (3 Months): An average of the number of shares that have traded over the last 3 months. This metric can be used to compare daily Volume against.
• Dividend Yield: This metric is huge! Volumes of books have been written about it! Simply put, it is the amount of money that the stock currently pays its shareholder this year (the dividend) divided by the share price for that day. Some people consider this to be very important part of how to read stocks because a company must be strong and healthy in order to issue continuously rising dividends. So on that note, we want to buy stocks with high dividend yields. But beware! Sometimes a company will issue an attractive dividend even though the financials aren’t doing very well. Make sure you look beyond just the dividend yield to get the whole story. Also keep in mind that there are plenty of great stocks that don’t issue dividends at all. As an example, Apple has performed phenomenally over the past few years but did not start paying dividends until recently. It is simply a company’s choice whether they do or do not.
Growth and Valuation:
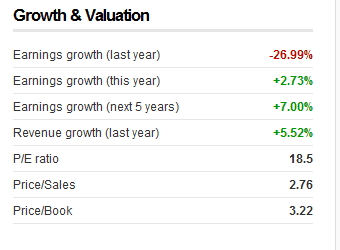
• Earnings Growth: These three values tell you how profitable (Sales minus Expenses) the company did last year, this year, and what they plan to do over five years. Ideally you want a company with a bright future and is going to grow over the next five years.
• Revenue Growth: Revenue is different from Earnings. Revenue is just the sales and income the company took in. Unlike profits, revenue does not take into account how many new expenses the company took on. For example, revenue may have increased by 10% but expenses could have increased by 20%. In that case, even though sales were doing good, the company spent more money and profits will be less than last year. So why bother looking at it when learning how to read stocks? Because sales figures cannot be manipulated the same way that earnings can be by accounting practices. There a dozen ways to report your profits which will change the way that earnings are presented. However, revenue is plainly how many sales were made – so it’s harder to manipulate this number. Again, we ideally want this number to be increasing.
• P/E Ratio: Probably the most widely popular metric investors focus on when learning how to read stocks. PE Ratio tells you how much you’re paying for a company’s earnings. A PE Ratio is simply the stock price divided by the amount of earnings per share. I will admit that at first this is a somewhat ambiguous and abstract concept. So the best way I can think to explain this concept is like this: Suppose My Money Design was making $10,000 per year. Would you rather buy my blog for $50,000 or $100,000? Guess what? That’s the difference between a PE Ratio of 5.0 and 10.0. The lower this number, the more attractive buying this stock is because you’re paying less for a slice of my earnings! But recall my warning above about how earnings can be manipulated.
• Price/Sales: Another ratio that shows how much you’re paying for a company’s sales. Similar to our explanation above about Revenue Growth, this ratio is important because it isn’t as susceptible to manipulation as earnings is. Since we’d prefer to buy stocks when sales are high but the price is low, a lower number is more attractive.
• Price/Book: The PB ratio is another important part of knowing how to read stocks because it can reveal whether a stock is over-valued or under-valued. The “book” part of it comes from a company’s Balance Sheet under the Equity section. Equity is found by taking Assets minus Liabilities. Inherently, as long as this number is positive, a company will have a book value. When you divide Price by Book Value, you will see the relation between what people are actually paying versus how much money the company truly has (cash, buildings, etc). A P/B value under 1.0 could indicate that the price is trading lower than the company may be worth. Likewise, a value above 1.0 will indicate that the price people are willing to pay is higher than what the company is actually worth. In general, we want to buy a stock when the P/B value to be low because it signifies that the price is under-valued relative to what the company is actually worth. However, remember that a company’s reputation can cause it to trade well above the sum of it’s book value!
Competitors:
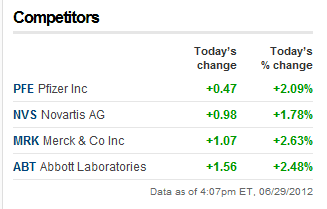
Who does this company compete with? This section lists some of the top competitors within the same industry as this company and their daily Price change. This information can tell you a few things:
• It’s a convenient way to research other similar stocks within the same industry and make comparisons about these metrics. It is generally a good practice to compare stocks within the same industry rather than across different industries (i.e. apples to apples comparison rather than apples to oranges).
• If your company is down and so are all the competitors, then perhaps the change in the market is universal and related more to a wide change in the economy. But what if your company is doing bad and some or all of the competitors are doing good? If this persists over the long haul, perhaps you need to re-evaluate your selection.
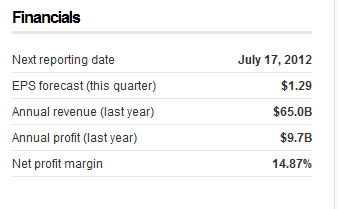
Financials:
The financials section is related to the performance of the company rather than the stock price.
• Next Reporting Date: This is the next time the company will be releasing their financial results. Depending on the news, this may result in swings either up or down in the price.
• EPS Forecast (This Quarter): This is a prediction of the Earnings Per Share for the upcoming report. The company’s ability to meet, exceed, or fall short of this target may cause the price to fluctuate.
• Annual Revenue (Last Year): How much sales did the company make last year? Hopefully this number is positive.
• Annual Profit (Last Year): How much money did the company take in last year after expenses last year? Again, hopefully this number is positive.
• Net Profit Margin: The percentage you get when you divide last years’ Profit by the Revenue. The higher this number, the better – higher profit margins can indicate financially healthy companies.
Profile:
Profile is the “About me” for a company: What industry they’re in, who’s in charge, where the headquarters is at, etc.
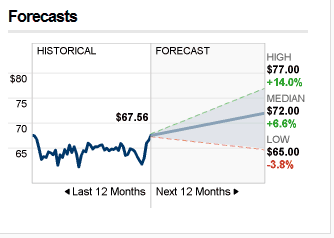
Forecasts:
Forecast tells us the analysts’ opinion about where the stock price may be heading over the next 12 months. Why even bother knowing how to read stocks when you could just look here and pick one where the high, median, and low are all going to be in the green and positive?
It’s not that simple! How do those analysts know where the Price will be in 12 months? THEY DON’T!! Forecast is simply a survey of opinions – nothing more. Obviously analysts are professionals and probably far more qualified to make a guess about where a stock price is heading than you or I could do. However, they are not fortune-tellers and could still be wrong. If nothing else, use this section to help validate your choice, but certainly don’t base your whole decision on this section only.
More on How to Read Stocks and Metrics:
If you haven’t had enough, stay tuned! We’ve barely scratched the surface of how to read stocks. There are dozens more stock metrics that both individuals and analysts look at when consider a prospect. Some of them require looking a little deeper and even involve a little math.
A good read that has helped me along the way has been The Neatest Little Guide to Stock Market Investing by Jason Kelly. I still refer to this book often for help on how to read stocks, or even just to refresh myself on the basics. Kelly also does a good job of taking things to the next level and introducing you to some of the more complicated and technical stock metrics for deeper evaluation.
How to Read Stocks – Putting It All Together:
So after teaching you how to read stocks, which metrics do you think will help you “pick the right ones”? The answer: It depends! Everyone has their own opinion about which metrics are the best ones to watch and how much those metrics should actually be.
However, one thing is for certain:
• You can’t pick a true winner based on just one or even a few of these stock metrics. They need to be used in combination with each other to reveal what’s truly going on with the company.
Think about it – Would you marry a person ONLY because they are good looking? What if they have a terrible personality? Annoying habits? Terrible with money? A criminal history! Do these things change your opinion of that person now? Of course they do!
In real life, we consider a great deal of factors before making an important decision. Stock picking is no different. There is a great deal of information both within these metrics and outside of them that can affect the overall outcome of how the stock does.
Summary:
Remember – Stocks are investments and need to be researched before you put your money (i.e. future) in them. There is no magic bullet to picking the perfect stock. But if nothing else, knowing how to read stocks and evaluate the basic metrics can be a very useful way to screen them for possible problems or buying opportunities.
Readers – Do you know how to read stocks? What are your favorite stock metrics when it comes to making your next pick? Which site do you use the most to get your information? What have your experiences been with using techniques and landing some winners?
Related Posts:
2) What Does “Stocks Return 8 Percent Each Year” Actually Mean?
Photo Credits: Microsoft Clip Art, CNN Money





I haven’t done a lot of individual stock picking, so I’m pretty worthless in this conversation.
I will say that the information you provided is excellent though. If the average person understood half of what you just taught them, then they’d be MUCH more likely to do better in investing than they would have without the knowledge.
Thanks! My hope is that this serves as a future resource for others once they finally get around to trying it out.
There is a great wealth of knowledge in this post but like Jason I do not invest in individual stocks. I think you are confusing debt and expenses though when you talk about growth and earnings.
Thanks for looking out! I made the change.
Great breakdown. Not everyone knows the bare basics and that is why they get confused and sometimes in trouble because of it. Very well written.
Thanks! This is just as much a re-fresher in the basics for me as it is a lesson for everyone else.
And, I’m one of those people that Chuck is referring to. I have little if any basic knowledge of individual stock and mutual fund investing, and find a lot of the information very confusing. However, I’m so impressed that you have such a head for this type info.
Thanks Anthony! Hopefully this information can serve you in the future if you ever decide to put it to task someday and try your hand at picking stocks.
I use Yahoo! Finance. While I don’t have a favorite (because I like having all of the info that you’ve laid out neatly above), I do like having a sheet of paper that I can write down questions as I read statistics about a company, like “Why did the price spike on that day?” “How come the book value is so high…how does that compare with book value of competitors?” I’ve found that list of questions to be invaluable when picking stocks, because as I ask more questions I narrow the chance I’ll be surprised by the stock later.
I do like Yahoo. Fidelity is also pretty comprehensive, but not everyone uses them as a broker. I like your methodology of using questions. I’m sure that approach goes far beyond just the metrics and probably yields you better results.
Thank you very much for this informative post MMD! I am just starting to move on from just investing in mutual funds. So I really needed this kind of crash course that would teach me at least what all these stats mean. I’m looking forward to future posts about this kind of stuff.
You’re welcome! And yes, there will be a lot more posts like this! If you’re just starting out with Mutual Funds, I’d like to recommend reading this post:
https://www.mymoneydesign.com/personal-finance-2/retirement/how-to-pick-good-mutual-funds-for-your-401k-or-retirement-plan/
Thanks MMD. I tend to avoid any posts that mention 401Ks though since I’m Canadian. I’m actually trying to move away from just relying on mutual funds. I’ve been told that mutual funds just results in extra fees.
If you just replace the word “401k” with whatever type of retirement account you have in Canada, the main idea will work the same way 🙂 Actually, I have invested in mutual funds for a number of years and found them to be both reliable and affordable. On the fees, like all things, you just have to pay attention to what you’re buying. By far, Vanguard has had the absolute lowest fees. For example, $10K in an Index Fund will cost you about $7 in fees. Not bad! You can barely buy a share of stock for that price. By design, most funds don’t fluctuate as wildly as stocks do, which makes them great for people who are just getting into investing.
I love growth stocks, so I normally look at company that has 25% annual earnings and sales growth(minimum). I also look at Price to sales ration; smaller the better. I don’t pay much attention to P/E ratio.
Growth stocks are enticing! I’m more of a value investor, but I think a good mix is important. Thanks for sharing your metrics.
Thanks for the information. I am planning to invest into mutual funds but I actually don;t know how to do it. I ask my friend about this but according to her that the processing is long.
You’re come to the right place for that! If you go to my “Start Here” page, I’ve got quite a few posts about buying mutual funds. I’d suggest these to start:
https://www.mymoneydesign.com/personal-finance-2/stocks/how-to-buy-an-index-fund/
https://www.mymoneydesign.com/personal-finance-2/retirement/how-to-pick-good-mutual-funds-for-your-401k-or-retirement-plan/
I’ve found mutual funds to be much, much easier on the mind when you’re first starting out – to buy, understand, and ride out as the market goes up and down.